KTKriekTrade Strategy Course in partnership with Market Traders Institute
Get the course

Three ways to trade the markets. One set of rules.

Swing trading, position trading and buy-and-hold investing — with exact rules for entries, stops, targets and when to stay out.

  • 25+ yrsin the financial markets
  • 15,000+traders trained
  • 2017Instructor of the Year, MTI
Doors open Wednesday 15 October 2026 Taught live by Tian Kriek, then kept on-demand. Seats are limited by the size of the live room.
days
hrs
min
Reserve a seat

Pick the strategy that fits your time

Each strategy works on a different time horizon. You'll learn all three, then use the one that suits your schedule, your account and your temperament.

Swing trading

Trades last days to a couple of weeks

Catch the next leg of a move. You'll find setups with a scanner, then plan the entry, the stop and a measured Fibonacci target before you place the trade.

Time needed
A short daily check
Main tools
Scanner, Fibonacci targets
Suits
Active traders with a day job

Position trading

Trades last weeks to months

Ride the big trends. You'll read the macro backdrop, identify which markets are in a trend worth owning, and manage the trade as it develops.

Time needed
A weekly review
Main tools
Macro data, trend structure
Suits
Patient traders who dislike noise

Buy and hold

Investments held for years

Build long-term positions on purpose. You'll value an asset before buying it and use long-cycle risk gauges to decide when to add and when to wait.

Time needed
A monthly check-in
Main tools
Asset valuation, cycle risk
Suits
Long-term wealth builders

Stop guessing. Start following rules.

Every lesson ends with a rule you can apply to the chart in front of you.

Swing Position Buy and hold All three
  • Find setups in minutes

    Use a multi-asset scanner to shortlist stocks, forex, crypto and commodities that match your rules, ranked by reward-to-risk.

  • Plan the whole trade up front

    Mark the A-B-C swing, then set your entry, stop-loss and 1.272 or 1.618 Fibonacci target before you commit.

  • Read the macro backdrop

    Understand how interest rates, inflation and the economic cycle push whole asset classes up or down.

  • Stay in a trend without panicking

    Know when a pullback is normal and when the trend has actually broken, so you exit for a reason rather than out of fear.

  • Value before you buy

    Judge whether an asset is cheap or expensive relative to its history, so you're not buying at the top of the excitement.

  • Pace your investing with the long cycle

    Use long-term cycle and risk gauges, including the 18.6-year property cycle, to decide when to add and when to hold cash.

  • Size every position properly

    Calculate how much to risk on each trade so a losing streak stays a setback, not the end of your account.

  • Build a plan you'll actually follow

    Combine the three strategies into one written plan that matches the time you have and the risk you can live with.

What one setup actually looks like

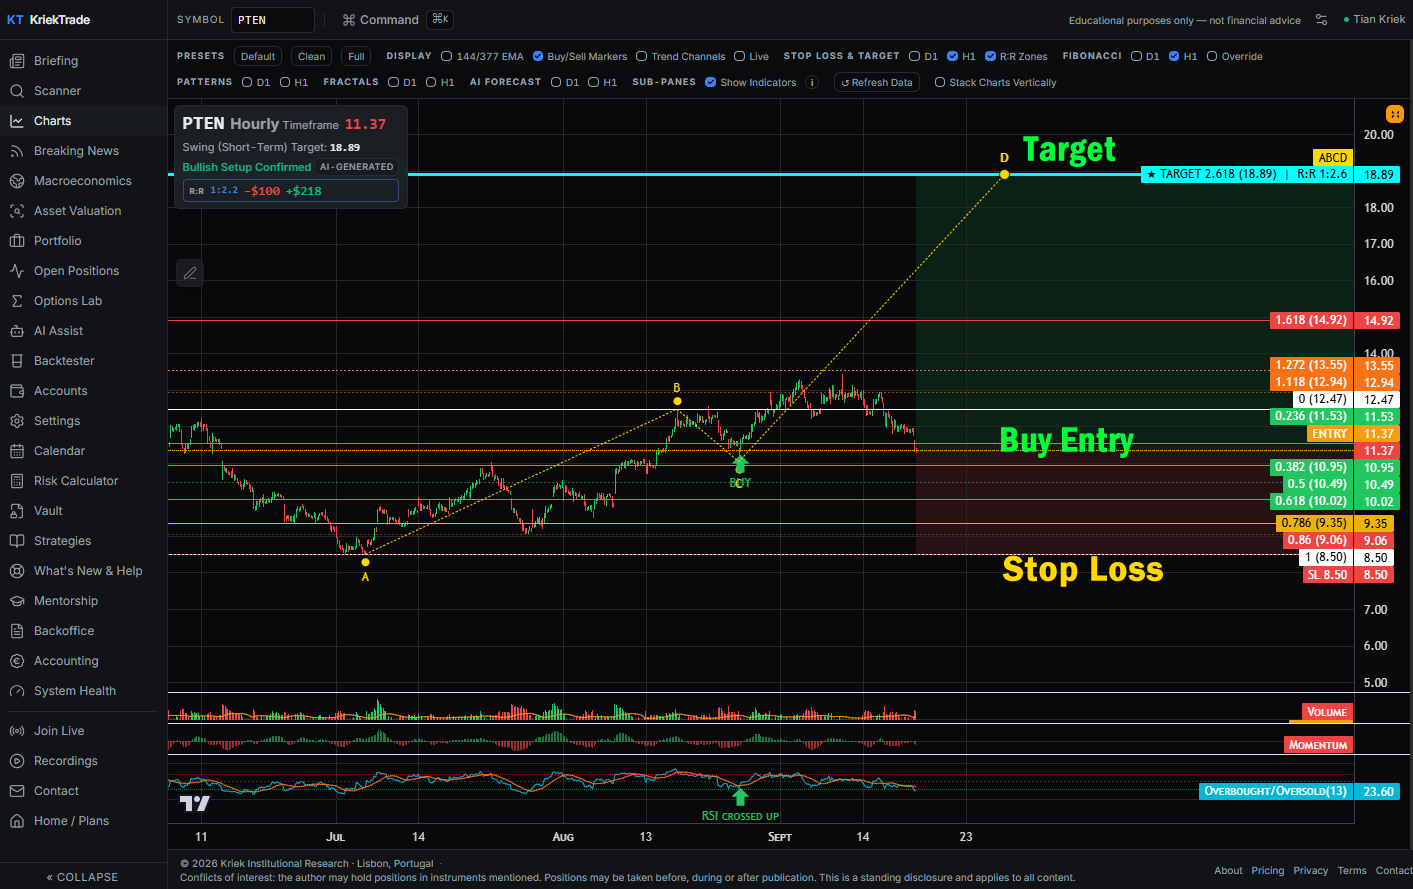
Patterson-UTI (PTEN), hourly chart, as the platform drew it on 19 September 2026. You are not asked to spot any of this by eye — the software marks it, and the course teaches you why each line is where it is.

The KriekTrade platform showing PTEN on the hourly chart: swing low A at 8.50, swing high B at 12.47, the buy entry marked at 11.37, the stop loss at 8.50 and the 2.618 Fibonacci target at 18.89, a reward-to-risk ratio of 1 to 2.6
An unedited screen of the platform. The green band above the entry is the reward, the red band below it is the risk, and the software drew every line — the fractals, the Fibonacci grid, the stop and the target — without being asked.
Swing low (A)8.501 Jul — the stop goes here
Swing high (B)12.4713 Aug — the move being measured
Entry11.37Risking 2.87 a share
Target (2.618)18.89Making 7.52 a share
  1. Measure the move

    The low at 8.50 and the high at 12.47 are 3.97 apart. Every other number on this chart is that 3.97 multiplied by a fixed Fibonacci ratio — so two prices produce the entire plan.

  2. Wait for the pullback

    Price fell back to 11.05, which is 35.8% of the move. Shallow. A shallow pullback means the buyers never really left, and it is what selects the far target instead of a near one.

  3. Take the trigger, not the guess

    You do not buy because it looks ready. You buy when momentum confirms it — RSI turning up at point C. Until that happens there is no trade, however good the chart looks.

  4. Put the stop where you are wrong

    The stop sits at 8.50, below the low that started the whole move. If price goes there, the reason for the trade no longer exists, and you are out for a known amount decided before you entered.

  5. Let the ratio decide

    Risking 2.87 a share to make 7.52 is 1:2.6 — the figure on the target tag. The platform's own risk panel puts the same trade at −$100 against +$218. Either way you know both numbers before you commit, and trades that do not clear your minimum ratio are simply not taken — which is most of them.

Read this honestly: this setup was live when the screenshot was taken, not finished. Point D is where the rules say the target is, not a result that has been banked. It is here to show you how a plan is built and what it costs you to be wrong — nothing on this page claims this particular trade paid.

Every number here was produced by MetaTrader, not by us

Most courses show you a screenshot. This one hands you the broker's own Strategy Tester reports — 221 of them, across two platforms and three accounts — and tells you how to reproduce each one on your own machine.

Five-year test
120
instruments traded together on one account, 2021–2026. Forex, indices, metals, energy, crypto and US shares.
Return, 0.25% risk per trade
+43.1%
$10,000 grew to $14,313 over 4.9 years — 7.6% a year, compounded.
Worst drawdown
−9.8%
The deepest fall the account lived through. The figure that decides whether you could have stayed with it.
Signals reproduced exactly
220 / 220
Every setup the platform fired, matched field for field by an independent MetaTrader build on two brokers' data.
What 1% risk would have made. The same 1,180 trades at 1% risk per trade turned $10,000 into $39,628 — a 296% gain, 32.5% a year. We do not teach that, and the reason is in the same data: at 1% the account held 77 positions open at once, put 77% of its equity at risk simultaneously, and fell 34% at its worst. The course teaches 0.25% because it is the version a real account survives.

The same strategy, four ways

TestRisk / trade$10,000 becomesPer yearWorst drawdown
Swing — what the course teaches0.25%$14,313+7.6%−9.8%
Position — longer holds, half off at target0.25%$14,622+8.1%−10.2%
Swing at full risk1.0%$39,628+32.5%−34.0%
Position at full risk1.0%$43,902+35.3%−35.1%

1,180 swing trades, 51.9% of them profitable, profit factor 1.29. Simulated results on historical hourly data, 2021–2026, spread and swap excluded in the platform test and included in the MetaTrader verification. The New Zealand dollar pairs and the VIX are excluded because five years of testing said they do not work — you will be shown that evidence too.

Independent verification
221
MetaTrader Strategy Tester reports — 182 on Ava Trade, 37 on RoboForex, 2 on MT4 — most at 100% real-tick quality.
Trades the macro filter refused
2,531
Of 3,747 valid setups, 68% were declined because the macro regime was against them. Losses avoided, not opportunities missed.
Forward test
Live
Running on a RoboForex MT4 demo since 14 August 2026, forex only, using the same signals you will receive.

Put your own number in

This is not a forecast. It applies the return the tested period actually produced to the amount you enter, so you can see the scale of it on your own capital — including the drawdown you would have had to sit through.

The course teaches 0.25%. Higher settings are shown because the tested data covers them — not because we suggest trading that way.

After 5 years, on the tested period’s result
$14,313
A gain of $4,313 — 7.6% a year, compounded, from 1,180 trades over 4.9 years.
Along the way the account fell 9.8% from its high — about $1,400 on this amount — and stayed down until the strategy recovered it. Any month of that is when people quit.

Simulated past performance on historical data. It is not a prediction, not a promise, and not financial advice. Trading carries risk and you can lose money. Figures assume every signal was taken, at the stated risk, with no withdrawals — none of which describes a real year of anybody’s trading.

What you will be taught

Nine modules, in the order a trader actually needs them: read the market’s weather first, then the setup, then the platform, then the automation, and finally the two things that decide whether any of it works — your position size and your own head.

0

Disclosures and how to read a signal

What the platform is and is not allowed to tell you, and why every signal is worded as an observation — “Bullish Setup Confirmed” — and never as an instruction to buy.

1

Core concepts

ABCD swings, true five-bar fractals, Fibonacci retracement and extension, the 144 and 377 exponential moving averages, and sub-waves — each one shown on a live chart rather than a diagram.

2

The macro regime The difference

The risk gauge, the 18.6-year cycle, the Fed’s posture and the yield curve — and how they combine into one rule that refused 68% of otherwise valid setups over five years. Includes worked examples of trades deliberately not taken.

3

The strategy, rule by rule

Swing and Position in full: trend, then swing, then arm, then fire, then target and stop. The exact state machine the platform runs — including why a setup you liked did not signal.

4

Reading the platform

Scanner, charts, daily briefing, risk calculator and Options Lab — one scenario followed end to end, from the morning briefing to the closed trade.

5

Evidence Reproduce it yourself

The backtests with the macro filter applied, the live forward test, and step-by-step instructions for reproducing every number on this page — in the platform’s own backtester and in MetaTrader 4 and 5.

6

Automation

The Expert Advisor on MT4 and MT5: installation, the settings that matter, the minimum-lot trap, how the take-profit follows the platform’s target, and the reward-to-risk floor. Shares are covered on MT5.

7

Equity management Why 0.25%

Risk per trade, the account-size table, and the arithmetic behind the number on this page: why the same trades make 296% at 1% and are untradable, and 43% at 0.25% and are survivable.

8

Trading psychology

Built around the platform’s own guardrails. The waiting states are not a delay — they are the discipline, enforced for you, on the days you would not have enforced it yourself.

Tian Kriek TK
Your instructor

Tian Kriek

  • 25+ yearsin the financial markets
  • 15,000+traders trained
  • 2017Instructor of the Year, Market Traders Institute

Tian started as a markets analyst and instructor in South Africa in the early 2000s, went on to trade futures and options, and spent nearly a decade at Market Traders Institute as an analyst, instructor and Senior Currency Strategist.

He founded KriekTrade to put the rules he teaches into software: a scanner, chart targets and macro risk gauges built for traders who want a process instead of predictions. This course is those rules, laid out strategy by strategy.

Questions people ask first

Who is this for?

Anyone who wants a written process instead of guesswork — whether you're placing your first trade or you've been trading for years without a consistent set of rules. You'll learn all three strategies and then pick the one that fits the time you actually have.

How much time does it take?

That depends on which strategy you choose to run. Swing trading needs a short daily check, position trading a weekly review, and buy-and-hold a monthly check-in. The course itself is structured so you can work through one strategy at a time.

Do I need experience, or special software?

No experience is assumed — the rules are taught from the ground up. You'll need charting software you're comfortable with. The course teaches the method, not one particular platform, so the rules carry over to whatever you already use.

Which markets does it cover?

The same rules are applied across stocks, forex, crypto and commodities. The point of a rules-based approach is that the process doesn't change when the market does.

Is this financial advice?

No. This is educational material about trading and investing methods. It is not financial advice, not a recommendation to buy or sell any instrument, and it isn't tailored to your personal circumstances. Trading and investing carry a substantial risk of loss — you should consider whether they are appropriate for you, and seek independent advice if you are unsure.

What happens after I sign up?

You'll get the course by email at the address you enter. You'll also receive related emails from KriekTrade, and you can unsubscribe from those at any time using the link in any message.

Trade with a plan you can actually follow.

Three strategies, clear rules, and a 25+ year market veteran showing you exactly how he applies them.

Send me the course

Educational material only, not financial advice. Trading and investing involve a substantial risk of loss.